
 Annika Björkholm
Annika Björkholm
Annika Björkholm
Data is only valuable if you can actually use it.
Too often, manufacturers are bogged down by unclear reports, clunky dashboards, and siloed information that's difficult to access and share. This makes it nearly impossible to gain a holistic view of operations and drive meaningful continuous improvement.
We enhanced L2L Analytics to put the power of data directly into the hands of operations leaders, maintenance teams, data analysts, and plant leaders—anyone striving for operational excellence.
We've broken down the barriers to effective data utilization, delivering insights in a user-friendly, intuitive, and visual format that gets everyone on the same page.
Here are the main updates:
1. Factory-proof business intelligence
Updated business intelligence (BI) capabilities help you unlock hidden opportunities in your manufacturing data. 
For example, you can now easily drill down on downtime data per line and look at trends over time.
- Optimize production processes and maximize efficiency with actionable insights.
- Pinpoint inefficiencies and root causes and confidently prioritize continuous improvement initiatives.
- Compare your performance against internal or industry standards and track the impact of investments.
Examples of some of our favorite BI reports:
1. Dispatch analytics 📊- View advanced OEE Pareto, bar chart, and trend reports.
- Benchmark performance against industry standards.
- Monitor the impact of improvement initiatives.
- Address bottlenecks by analyzing time and resource allocation.
- See past, scheduled, and ongoing activities.
- Reduce work order response times.
- Identify root causes.
- Implement proactive measures.
- Justify investments in proactive maintenance.
- Benchmark performance against industry standards.
- Monitor checklist completion rates and times.
- Identify areas for improvement.
- Ensure adherence to critical procedures.
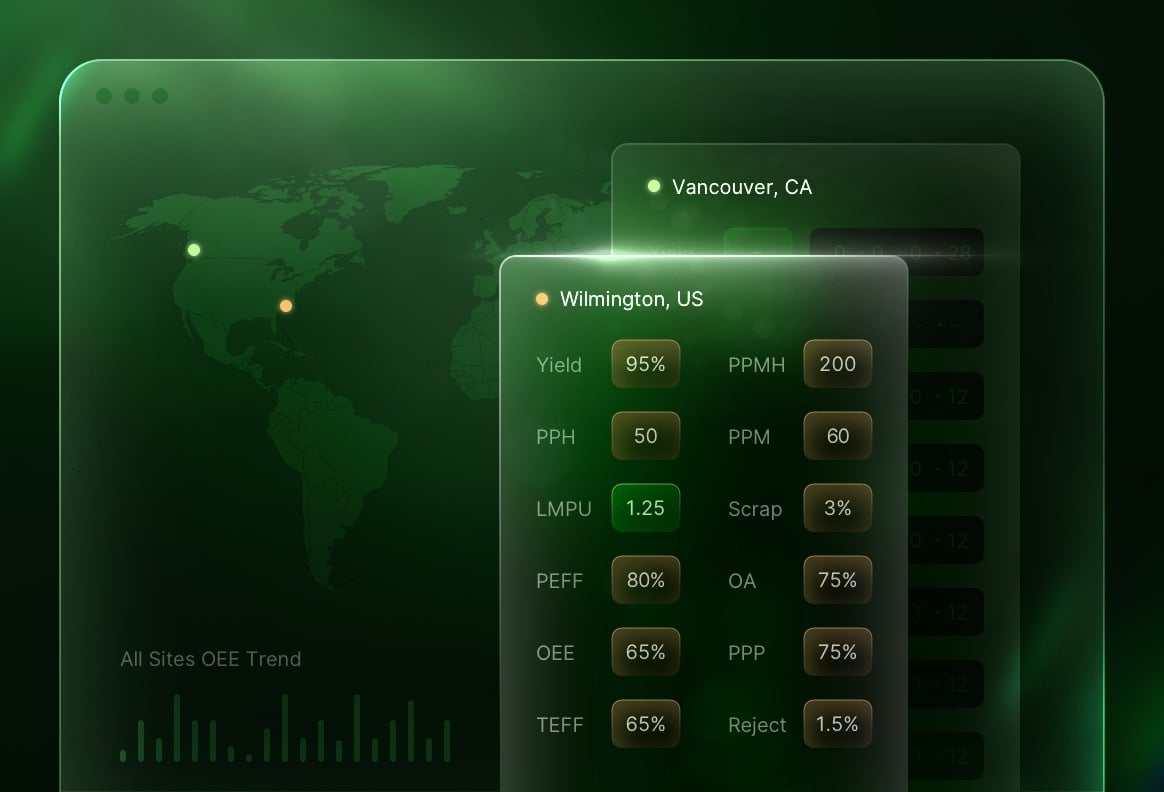
2. Consolidated dashboards
We now also offer consolidated dashboards that contain all the reports that are meaningful to your team.

- Access a comprehensive view of your operations with dynamic dashboards that consolidate all KPIs in one place.
- Highlight the most critical performance indicators to see what drives impact.
- Spot downtime trends, pinpoint problem areas, and assess the impact of maintenance initiatives.
3. Go granular with your insights
Zoom in on details to identify the root causes of problems.

Dive deeper into your data by double clicking the information that's useful to get more valuable insights
- Drill down into specific areas of your operations to understand performance at a detailed level.
- Identify patterns and correlations within your data that might otherwise go unnoticed.
- Uncover root causes and take action to prevent them from happening in the future.
4. Drag-and-drop builder
Build the exact charts you and your team need, fast and easy.
 The drag-and-drop chart creator makes it efficient to create any report you want
- Flexible creation of insightful charts and graphs in minutes, no technical expertise required.
- Transform complex data into compelling graphs that tell a story and drive understanding between all team members.
- Reduce reliance on IT and data resources.
Built for the ones who need insight into plant performance
| Operations leaders | Plant leaders | Maintenance teams | Data and business analysts |
|
|
Manage capacity, resources, and costs (labor, maintenance, equipment lifespan). | Optimize PM schedules to minimize unplanned downtime. | Build intuitive dashboards for clear KPI visualization and trend identification. |
| Track key metrics (output, defects, delivery) to measure progress and impact. | Analyze production data (defects, batches, machines) to root out quality issues and optimize schedules. | Track work orders, schedules, and on-time performance. | Automate reporting to generate regular key metric updates. |
Want to see our revamped reports and dashboards? 📊→ Schedule your demo


