


 Shop floor execution
 Maintenance
 Production
 Skills
.svg) Execution AI
Execution AI
 Quality
 Training & Skills
 Building materials
 Packaging
 CMMS/EAM
 MES
MES
 Connected Worker
 Manufacturing Intelligence
 Case studies
 Blog
Blog
 Ebooks & Guides
 Webinars
 Events
 Downtime Cost Calculator
 Digital Maturity Assessment
 About Us
 Partners
 Newsroom
 Support
 Careers
 Trust center
Trusted by global manufacturing leaders


From "What Happened" to Action
Skip the manual data-crunching. Use our library of Solvers, pre-built AI prompts focused on common shop floor challenges, to instantly turn floor data into a Solve: a definitive action plan that tells your team exactly what to do next.
.jpg)
Your Floor, Your Data, Your Solves
Create custom Solvers tailored to your site's specific operational hurdles. Turn your unique data into a personalized Solve that resolves disruptions once and for all.
.jpg)
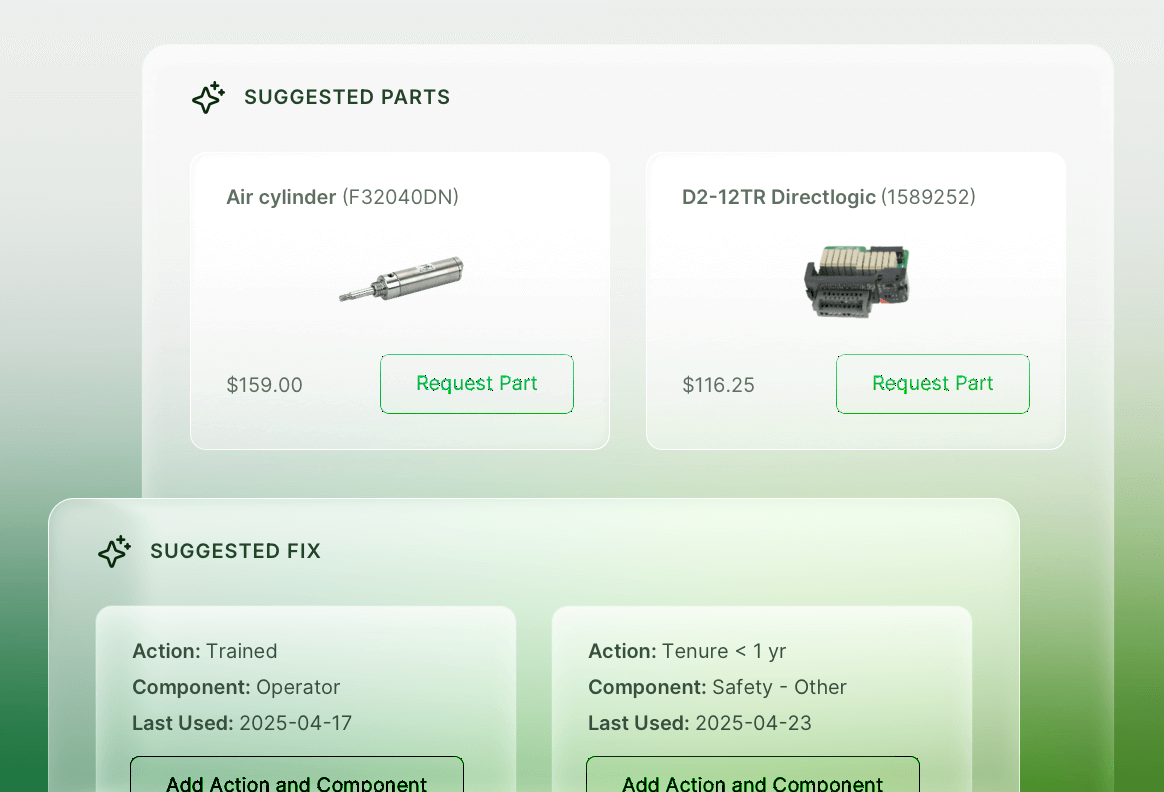
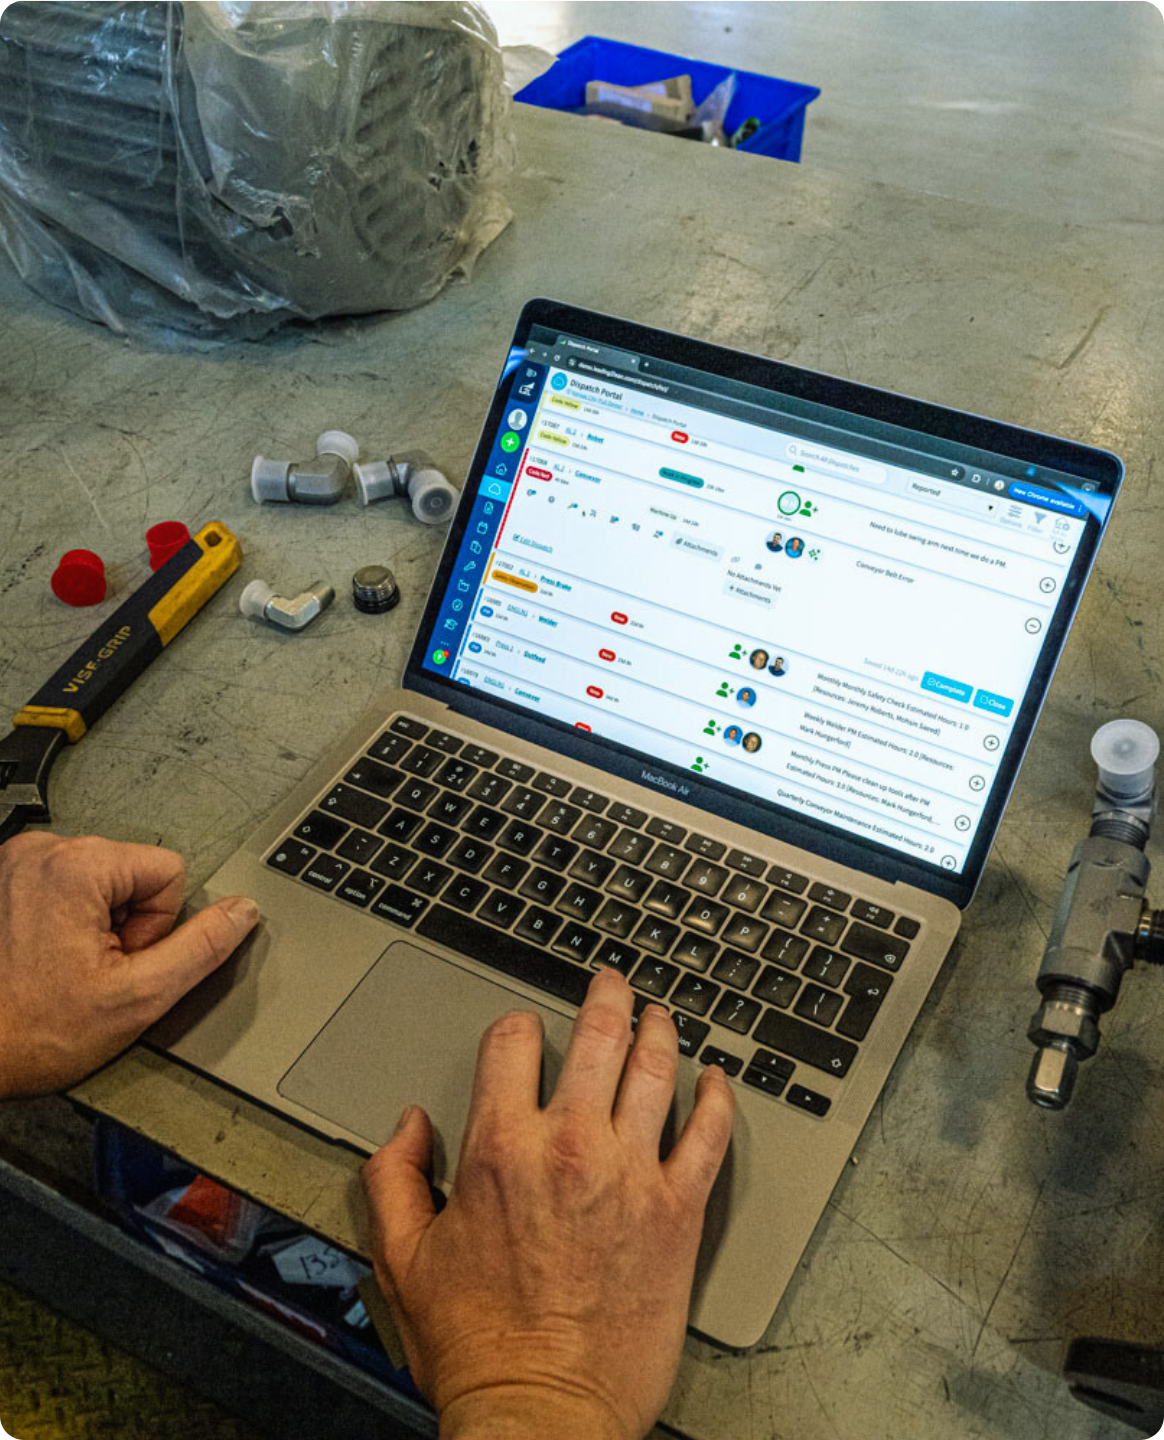
Suggestions within your workflow
Get AI recommendations for probable spare parts and suggested fixes based on historical data.
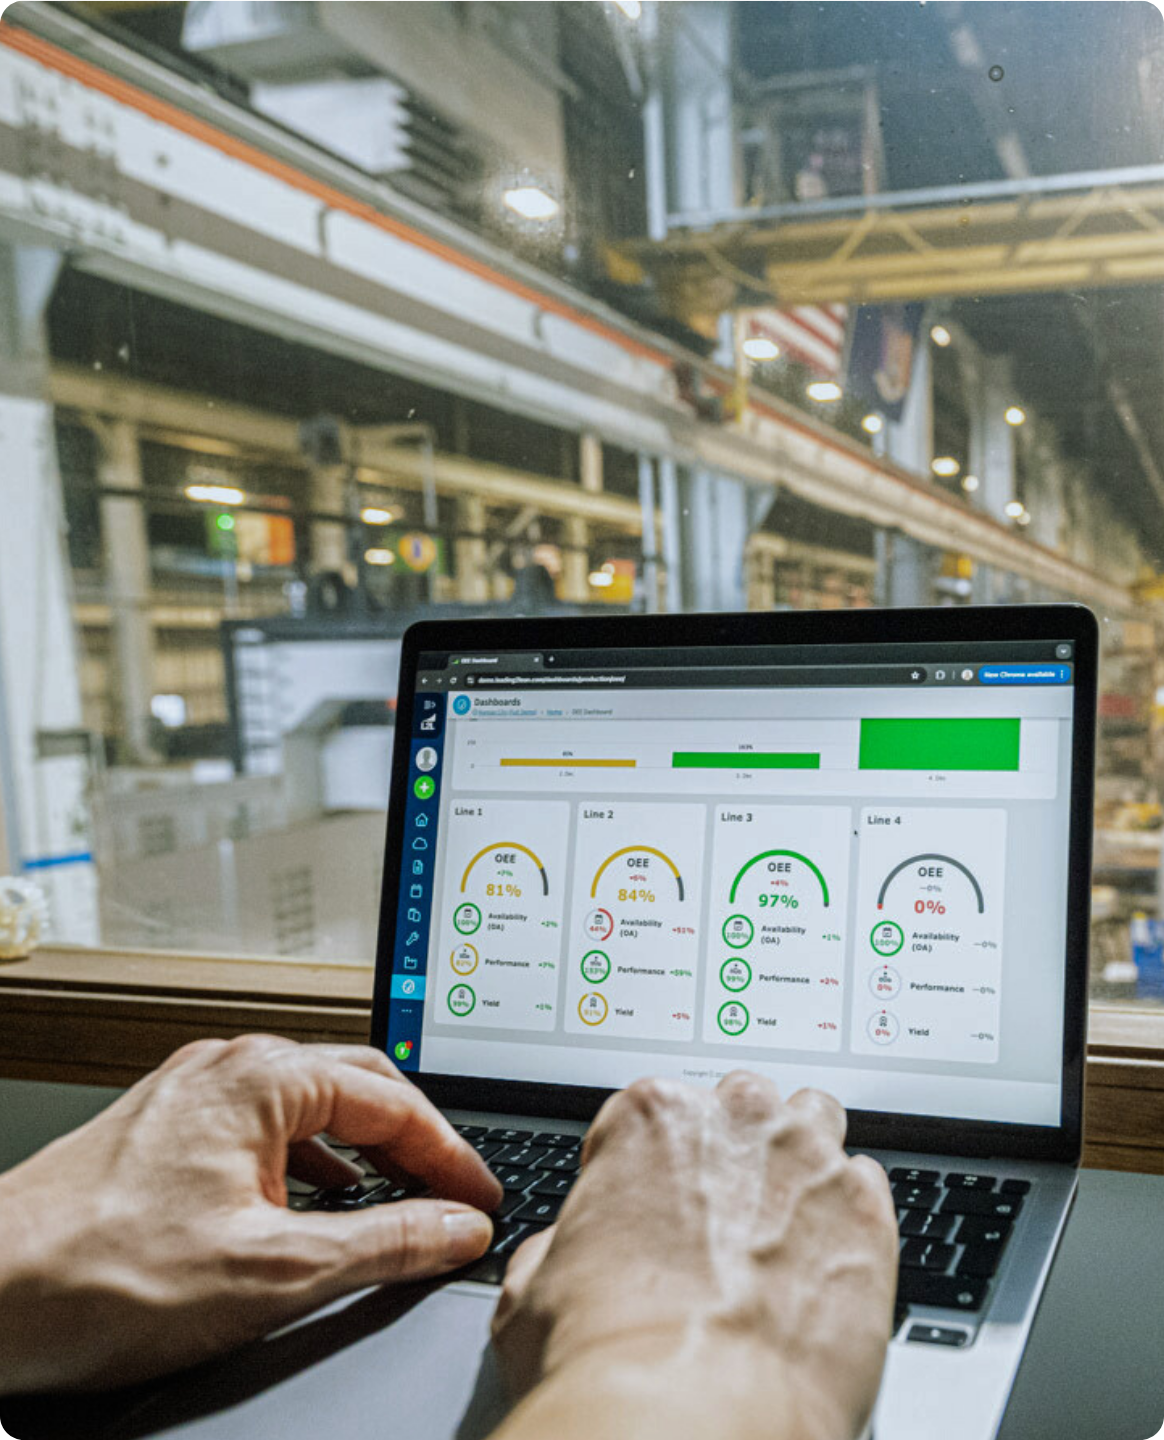
Benchmark, analyze, and act
Benchmark performance against industry standards, track the impact of improvement initiatives, and compare plant performance across the entire enterprise with comprehensive analytics.
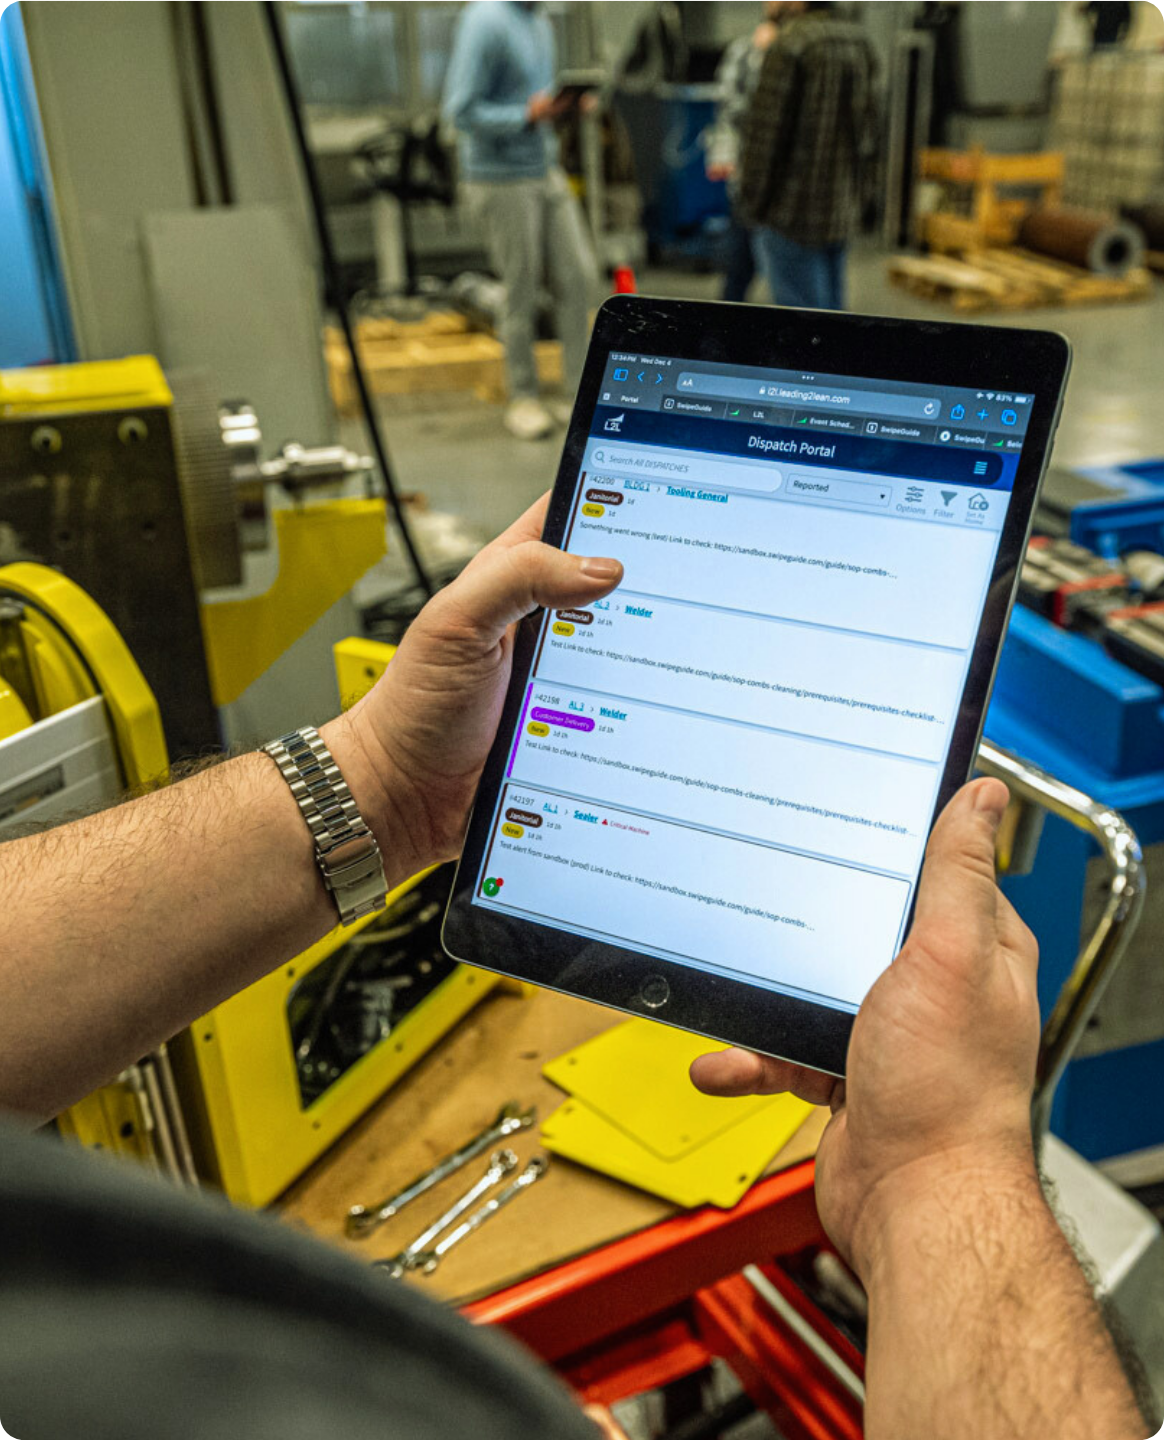
Shift-by-shift optimization
L2L Execution AI delivers instant answers to your most pressing shop floor challenges. Use our library of out-of-the-box Solvers—or create your own—to diagnose disruptions and give your team the expert-level Solves they need to win every shift.
.gif)
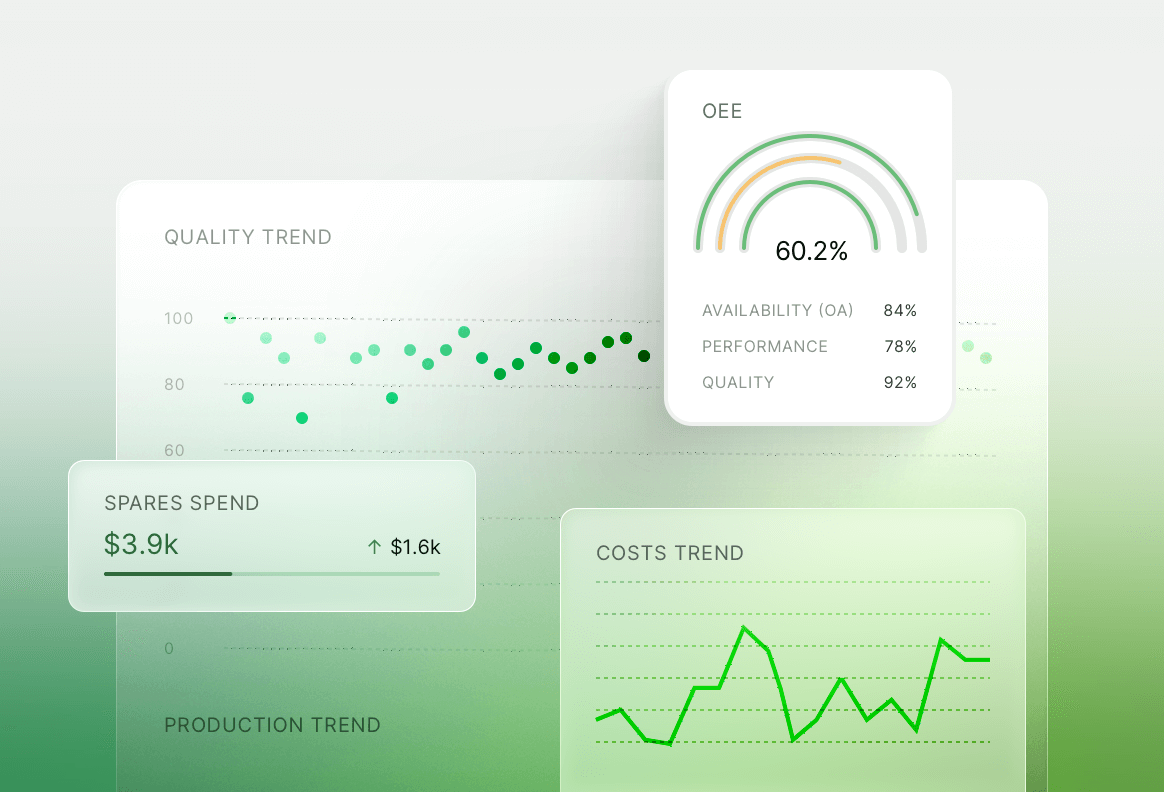
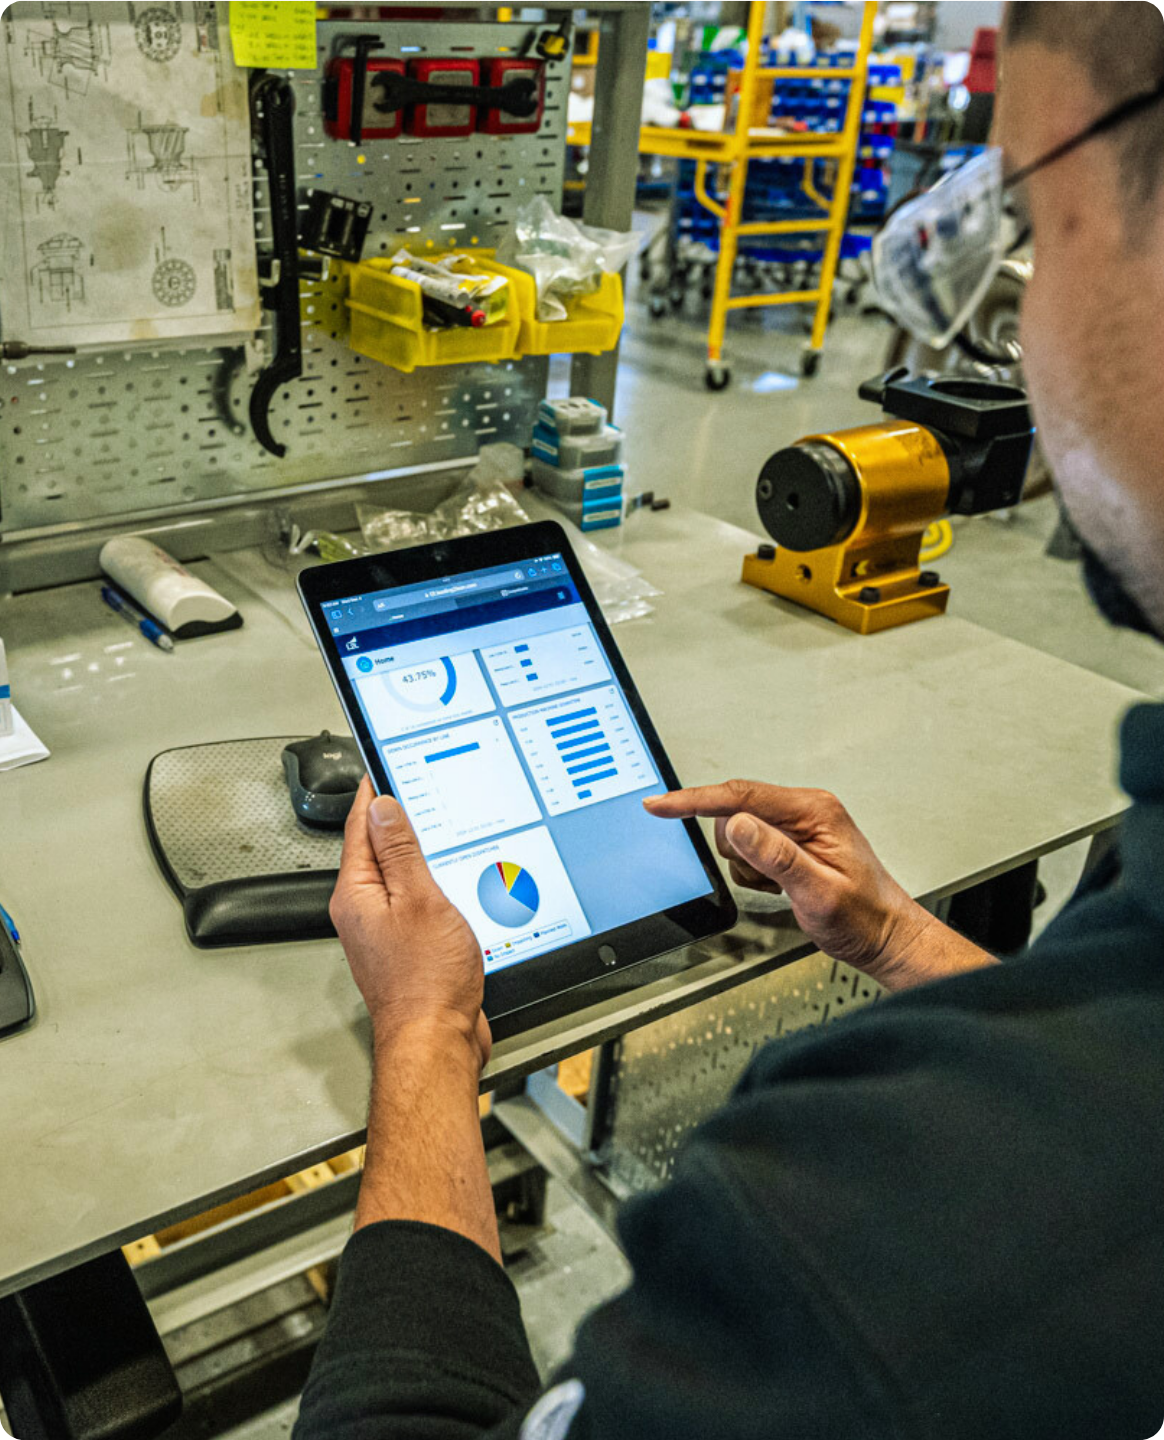
Analytics that have your back
Make informed decisions, every time. Intuitive dashboards and cross-site data consolidation help you spot downtime trends, pinpoint problem areas, and assess the impact of maintenance initiatives.
Boost performance and track progress by monitoring the impact of improvement initiatives. Adjust your strategies accordingly with our advanced OEE Pareto, bar chart, and trend reports.
Address bottlenecks by analyzing time and resource allocation. Gain visibility into past, scheduled, and ongoing activities to optimize workflows. Reduce work order response times and enhance overall operational performance.
Reduce downtime and improve equipment reliability by identifying root causes and types of reactive maintenance while implementing proactive measures. Make data-driven decisions to justify investments in proactive maintenance and benchmark performance against industry standards.
Track progress and ensure compliance by monitoring checklist completion rates and flagging potential issues. Analyze completion times and identify areas for improvement. Ensure adherence to critical procedures with metrics and charts that keep your team on track.
Insights made for real continuous improvement
Keep track of KPIs at scale. Discover trends, catch anomalies, identify root causes, and make informed decisions with L2L’s suite of manufacturing intelligence tools.


Compare operational performance across different plants, departments, and product lines to identify best practices and areas for improvement. Monitor production output, defect rates, and on-time delivery to track and measure the impact of improvement initiatives.
Keep track of production capacity, labor availability, operating costs, maintenance expenses, and expected equipment lifespan. Adjust production schedules and allocate resources while analyzing data on defect types, production batches, and machine performance to pinpoint the root causes of quality issues.
Determine the effectiveness of existing PM schedules and adjust them to minimize unplanned downtime. Keep track of work orders, schedule reports, and get on-time percentages when you need them.


